Correction / Retracement
Markets move in rhythms. An impulse wave that defines a major market trend will have a corrective wave before the next impulse wave reaches new territory. This occurs in either bull market or bear market conditions. The most common approach to working with corrections is to relate the size of a correction to a percentage of a prior impulsive market move.
Correction 38.2% for EMC indicates continuation of the primary up-trend.
Extension
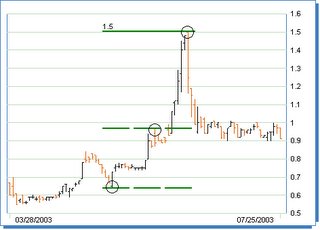
Extensions are exuberant price movements. They express themselves in runaway markets, opening gaps, limit-up and limit-down moves, and high volatility. These situations offer extraordinary trading potential as long as the analysis is carried out in accordance with sensible and definite rules.
Price of SRX (Canada) reaches the level that can be precalculated as the previous up-swing size multiplied by Fibonacci ratio 1.618
Valleys in the down-trend of STEA (Canada) are correctly identified from the original swing size by multiplying it by 3 numbers from Fibonacci ratio scale: 1, 1.618, 2.618
Time projection
Fibonacci time projection days are days on which a price event is supposed to occur. Time projection analysis is not lagging but is of forecasting value. Trades can be entered or exited at the price change rather then after the fact. The concept is dynamic. The distance between two highs or two lows is seldom the same, and time projection days vary, depending on larger or smaller swing sizes of the market price pattern.
Length between two peaks of NT multiplied by Fibonacci ratios 1.618 and 2.618 gives accurate forecast on another two peaks drawn weeks into the future
Channel
Human behavior is not only reflected in chart patterns as large swings, small swings or trend formations. Human behavior is also expressed in peak-valley formation. Fibonacci channels make use of peak and valley formations in the market and lead to conclusions on how to safely forecast major changes in trend directions.
The secret of Fibonacci channels is to identify the correct valleys and peaks to work with. Support and resistance lines can be drawn weeks and months into the future, once the appropriate tops and bottoms in the market have been detected.
Having prominent peaks and valleys creates an opportunity to see major support and resistance lines for SUNW before they are realized by general public
Ellipse
Fibonacci ellipses identify underlying structure of price moves. Fibonacci ellipses circumvent price patterns. When a price pattern changes, the shape of the ellipse circumventing the respective market price pattern changes too. We can find long and short ellipses, fat and thin ellipses and ellipses that are flat or have a steep angle. There are very few market price moves that do not follow the pattern of a Fibonacci ellipse.
The strength of Fibonacci ellipses is that no matter how many waves or subwaves we find in a price pattern, we receive a solid overall picture of the total price pattern as long as it can be circumvented by a Fibonacci ellipse.
Never ending small waves of MSFT is not a source of confusion once the first point and a swing size are realized. Fibonacci ellipse with ratio 6.854 pin points target price and overall pattern.
Fans
Fibonacci fans name derives from the fanlike appearance of the three trendlines shown. The Fibonacci fans are drawn using typical tops or bottoms. The three Fibonacci fans project into the future with slopes at 38.2, 50 and 61.8% (additional levels are also available). As the daily prices pass these three fans, we make predictions about future price movements based upon whether there appears to be price resistance or support at these intersection points. If the prices hold at the fan line, there is support there, if they quickly move through the fan line, then you will not see support until the next fan line is met.
INTC started its bull rally in early 2003 and we were able to project support and resistance level all the way to 2004.
Spiral
Fibonacci spirals provide the optimal link between price and time analysis and are the answer to a long search for a solution to forecasting both time and price. Each point on a spiral manifests an optimal combination of price and time. Corrections and trend changes occur at all those prominent points where the Fibonacci spiral is touched on its growth path through price and time.
You will be astonished to see that if the correct center is chosen, Fibonacci spirals pinpoint turning points in the market with an accuracy seldom before seen. Investing based on spirals is neither a black-box approach nor an overfitted computerized trading system. It is a simple universal geometrical law applied to different sorts of products such as futures, stock index futures, stocks or cash currencies.
Timing and price of most key peaks and valleys of EAG are already known in late May 2003 - that is the power of Fibonacci spiral.
Tags: fibonacci ellipse, fibonacci channel, fibonacci level, gann angle
Fibonacci shapes (tools)


2 comments:
Looking for more information on business process modeling uml strategies ..If so here is a fantastic resource for everything related to business process modeling uml strategies with information, products, articles and more..Check it out here...corpanalytics.com
I have been following a site now for almost 2 years and I have found it to be both reliable and profitable. They post daily and their stock trades have been beating
the indexes easily.
Take a look at Wallstreetwinnersonline.com
RickJ
Post a Comment