Markets analyses, brokers review, autotrading

Tuesday, February 14, 2006

HyperTools

HyperTools is a universal converter, allows processing ASCII, Excel, MetaStock, OMZ and XPO format. You will be able to create your OMZ/XPO directly from any ASCII, Excel or MetaStock files or export to ASCII, Excel or MetaStock the historical data stored into OMZ/XPO. If you are eSignal, QCharts, RealTick, QuoteSpeed, MetaTrader, DTN's IQFeed, FutureSource ProNET data subscribers you can create your OMZ/XPO files directly from your online datafeed.

HyperTools for XPO Premium Edition

The new HyperTools for XPO allow now to save directly into GlobalServer your historical data, without any XPO import file. Builds Daily data by Tick or Intraday data source.

Tags: , ,

HyperTrader Tech. Innovative Technologies for Traders

Sunday, February 12, 2006

Sizing up Deep Blue

Deep Blue was the brainchild of Feng-Hsiung Hsu who began researching computer chess at Carnegie Mellon University where he received his Ph.D. in Computer Science in 1989. Chess had been viewed as a fundamental challenge in the field of Artificial Intelligence. Hsu's idea was to obtain orders-of-magnitude improvements in performance by parallelizing the processing of chess positions.

In addition to parallel algorithms, implementing Hsu's idea required close integration of software algorithms and hardware circuits.

By beating the World Champion in a six-game match in 1997, it was finally proved that a brute force search of chess moves is superior to the most sophisticated human conceptual understanding of the game and superior to the ability of the most skilled humans to calculate chess moves.

The meaning of these results continues to be debated today because searching through all possible moves up to 8 moves ahead is definitely not how humans play the game. In his book Deep Blue: Building the Computer that Defeated the World Chess Champion, Hsu equates Deep Blue to any other tool devised by humans that can perform a specific task better than a human. Deep Blue did not possess an intellect or consciousness and was literally just a machine. What is more important, according to Hsu, is that the creation of Deep Blue is a human accomplishment.

In the past, building a personal computer equivalent to Deep Blue was not a realistic goal. IBM had spent millions on Deep Blue (the cost of the Deep Blue project from 1985 to 1997 is estimated to have been over $100 million), which was a massively parallel RS/6000 SP based computer with 32 processors that could evaluate 200 million chess positions per second.

Setting aside the multi-million dollar price tag, Deep Blue consisted of a pair of 6-foot, 5-inch black towers weighing 1.4 tons. Deep Blue's processors, designated "P2SC", integrated eight older Power2 chips on a single die with a total of 15 million transistors. Thus in terms of processor chips alone Deep Blue contained 480 million transistors; but the Deep Blue team did not stop there. In 1997 Deep Blue also contained 512 Application Specific Integrated Circuits (ASICs), each with 1.3 million transistors for an additional 666 million transistors resulting in a grand total of 1.15 billion transistors.

Because there are an estimated 10120 possible positions in a chess game, playing chess well from a computing standpoint depends on how many positions can be compared within a time limit, such as in a chess tournament time control of 40 moves in 2 hours. Computing speed and brute-force calculations are the only way computers can challenge human understanding of the game: Machines don't understand the game in terms of human ideas, but they can calculate good moves. Table 1 shows how Deep Blue's calculations evolved between 1985 and 1997.

Year Positions per Second
1985 50,000
1987 500,000
1988 20,000
1989 2,000,000
1991 7,000,000
1996 100,000,000
1997 200,000,000

If Deep Blue's computing power is compared with its chess rating, assuming Deep Blue was a chess master (rating 2200) in 1985 and equal to the World Champion in 1997 (chess rating 2800+), we can see a dramatic acceleration of the number of chess positions per second necessary to achieve a significant gain in chess rating. On average, the number of positions per second evaluated by Deep Blue increased by a factor of 2.2 times the number of positions per second every year, and an average of two years passed for every 100 point chess gain in Deep Blue's rating.

As a result, if Gary Kasparov's chess rating had been 2900, rather than 2820, it would have taken IBM at least another two years to develop a computer that could beat him.

What is interesting, however, is that it would have required calculating nearly 1 billion positions per second (969,289,665) to reach the chess rating of 2900 (see Table 2).

This is not surprising, given that the number of possible chess positions expands exponentially in a tree of possible positions. Considering that, Deep Blue ultimately represents a brute force approach to the problem of making computers play chess. Calculating all possible moves for 10 moves, for example, involves roughly 10 trillion possible positions. It's no wonder that IBM denied Kasparov a rematch because if Deep Blue had lost IBM would have to have invested substantially more money to win the next match.

Tags: , , ,

Project Deep Blitz: Master-Level Chess on a PC--ExtremeTech Feature

Saturday, February 11, 2006

Trading blog-test

Now I can spam blog via e-mail.
It's test post.

Friday, February 10, 2006

Trading Options

Option is a legal agreement between buyer and seller to buy or sell security at an agreed price in a certain period of time. It is quite similar to insurance that you pay an amount of money in order that your property is protected by the insurance company. The difference between these two is option can be traded whereas, insurance policy cannot be traded. There are two types of option contracts; call options and put options. We buy call option when we expect the security price will go up and buy put option when we expect the security price will go down. We also can sell call option if we expect the security price will go down and vice versa if we sell put option. Usually, option is counted by contract, one contract equivalent to 100 unit options. 1 unit option protects 1 unit share. So, one contract protects 100 unit shares.

Before learning how to trade option, terminologies that you need to know are as follow:

a) Strike price: Strike price is the price that is agreed by both buyer and seller of the option to deal with. That means if the strike price of the call option is 35, seller of this option obligates to sell security at this price to the buyer of this option even though the market price of the security is higher than 35 if the buyer exercises the option. Buyer of this option can buy a security with a price that is lower than the market price. If the current market price is $39, the buyer will earn $4. If the security price is lower than the strike price, buyer will hold the option and leave the option to expire worthless. For put option strike price, buyer of the option has the right to sell the security at the strike price to the seller of the option. That means if the put option strike price is 30, seller of this option obligates to buy the security at this price from the buyer if he or she exercises the option even though the market price is lower than this price.

If the market is $25, the option buyer will earn $5. It looks like a lot of transactions have been involved; but actually, seller of the option will not buy a security and sell it to the buyer. The broker firm will do all the transaction but the extra money that has used to buy the security has to be paid by the seller. This means, if the seller loss $4, the buyer will earn $4.

b) Out of the money, in the money and near/at the money option: Option price comprises of time value and intrinsic price.

Time Value + Intrinsic Value = Option Price

Time value is the amount of money that the option worth due to the time the option has until its expiration date. Longer the time the option has until its expiration date, higher the time value of this option. Time value of an option will become zero if the option has expired. Intrinsic value for in the money call option is the difference between current market security price and option strike price. Conversely, in the money put option’s intrinsic value is the difference between option strike price and current market security price. If the current security price is lower than the call option strike price, this option is an out of the money option. It only has time value. Call option with strike price that is lower than the current market security price is an in the money option. This option has time value and also intrinsic value. Near or at the money option is the option, which strike price is close to the current market security price.

c) Delta value: Delta value shows the amount of the option price will change when the security price changes by $1.00. It is a positive value for call option and negative value for put option. It ranges from 0.1 to 1.0. Delta value for in the money option is more than 0.5 and out of the money option is less than 0.5. Delta value for deep in the money option usually is more than 0.9. If the option delta value is 0.6, meaning that when the security price goes up $1, option price will go up $0.60. If the security price goes up $0.10, the option price will goes up $0.06. Usually, $0.06 will round up to $0.10.

d) Theta value: Theta value is a negative value, which shows the decay of the option time value. Option, which has longer time to expiry, has lower absolute theta value than option, which has shorter time to expiry. High absolute theta value means the option time value decays more than the low absolute theta value option. A theta value of -0.0188 means that the option will lose $0.0188 in its premium after passage of seven days. Options with a low absolute theta value are more preferable for purchase than those with high absolute theta value.

e) Gamma value: Gamma value shows the change of the delta value of an option when the security price increases or decreases. For an example, gamma value of 0.03 indicates that the delta value of this option will increase 0.03 when the security price goes up $1. Option, which has longer time to expiry, has lower value of gamma than option, which has shorter time to expiry. The gamma value also changes significantly when the security price moves near the option strike price.

f) Vega value: Vega value shows the change of the value of option for one percent increase in implied volatility. This value is always positive. Near the money option has higher vega value compared to in the money and out of the money option. Option, which has longer time to expiry, has higher vega value than the option, which has shorter time to expiry. Since vega value measures the sensitivity of the option to the change of the security volatility, higher vega value options are more preferable for purchase than those with low vega value.

g) Implied volatility: Implied volatility is a theoretical value, which is used to represent the volatility of a security price. It is calculated by substituting actual option price, security price, option strike price and the option expiration date into the Black-Scholes equation. Options with a high volatility stocks are cost more than those with low volatility. This is because high volatility stock option has a greater chance to become in the money option before its expiration date. Most purchasers prefer high volatility stock options than the low volatility stock options.

Actually, there are twenty-one option trading strategies, which most of the option investors and traders use in their daily trading. However, I’m only introducing ten strategies as follow:
a) Naked call or put
b) Call or put spread
c) Straddle
d) Strangle
e) Covered call
f) Collar
g) Condor
h) Combo
i) Butterfly spread
j) Calender spread

Naked call and put meaning buy call and put option only at the strike price, which is close to the market security price. When the security price goes up, the profit is the subtracting of the security price to the strike price if you buy call and the reverse if you buy put.

Call and put spread is established by buying in the money or near the money option and selling out of the money option. When the security price goes up, in the money call option that you buy will generate profit and the out of the money option that you sell will loss money. However, due to the difference of the delta value, when the security price goes up, in the money call option price goes up with a higher rate compared to the out of the money call option. When you deduce the profit from the loss, you still earn money. The purpose of selling the out of the money option is to protect the depreciation of time value of in the money call option, if the security price goes down. However, if the security price continuously goes down, this will cause an unlimited loss. Therefore, stop loss has to be set at certain level. This strategy also has a maximum profit that is when security price has crossed over in the money option strike price.

Straddle can earn money no matter the security price goes up or down. This strategy is established by buying near the money call and put option at the same strike price. The disadvantage of this strategy is the high breakeven level. The sum of the call and put option ask price is the breakeven level of this strategy. You only generate profit when the security price has gone up or down more than the breakeven level. If the security price fluctuates within the upside and downside breakeven level, you still loss money. The money that you loss is due to the depreciation of the option time value. This strategy is usually applied for the security, which has high volatility or before the release of the earning report. The maximum loss of this strategy is the total amount of call and put option price. This strategy can generate unlimited profit at either side of the market direction.

Strangle is quite similar to straddle. The difference is strangle is established by buying out of the money call and put option. Because both the options are out of the money option, therefore, both options have different strike. The maximum loss of this strategy is less than the straddle strategy, but difference between the upside and downside breakeven level is slightly higher than the straddle strategy. For this strategy, the upside breakeven is calculated by adding the total call and put option prices to the call option strike price. While, the downside breakeven level is calculated by subtracting the put option strike price with the total call and put option prices. The difference between the strike prices usually is about 2.50 or 5 depending to which stock that you select to buy with this strategy. If the security price fluctuates within the upside and downside breakeven level, you still loss the money due to the loss of the option time value. Application of this strategy is the same as the straddle strategy.

Covered call is established by buying a security at the current market ask price and selling out of the money call option. Selling out of the money option has limited the profit that generated from this strategy. If security price continuously goes down, it will cause an unlimited loss. Therefore, stop loss must be set. When the option has comes to its expiry, if the security price is not moving up significantly, you still earn the total option premium that you have received. If the security price goes up, sure you will earn a limited profit. If the stock price continuously goes down, it will cause an unlimited loss. Therefore, stop loss must be set. Usually, stop loss is set at the security ask price after subtracting by the option bid price. If this security price goes down and passes over the price that you set as stop loss, the loss that is incurred to you is about half of the total option premium that you have received. This is because the delta value of the out of the money call option that you have sold is about 0.4 - 0.5. The out of the money call option strike price must be the closest strike price to the entering security price.

Collar is also known as medium covered call. It is quite similar to covered call strategy. It is only added one more step in order that stop loss is unnecessary to be set in this strategy. This strategy is established by buying a security and near the money put option and following selling an out of the money option. Due to the put option that you have bought, it is unnecessary to set a stop loss because put option will protect the security if the security price goes down. However, out of the money option premium that you have collected has to be used to pay for the put option premium. If the security price goes down, you still loss about half of the total put option premium. This is because out of the money call option premium is less than the near the money put option premium. This strategy is for half or one year long term investment.

Condor strategy has four combinations. Two of them are for stationary market and the other two are for dynamic (volatile) market. Long call and put condor are for stationary market whereas short call and put condor are for dynamic market. The former strategy involves four steps that are buying and selling in the money and out of the money call option with an equivalent amount of contract. With this strategy, profit can be generated as long as the security price does not fluctuate out from the upside and downside breakeven level. Short call and put condor are for dynamic market, which also involves four steps like the long call and put condor strategy. The difference is that in short call and put condor, the strike prices of the options that have bought must be within the strike prices of the options that have sold. For short call and put condor strategy, profit can be generated as long as the security price has fluctuated out of the upside and downside breakeven level. The upside breakeven level is calculated by adding the whole position total pay out or receive to the highest strike price in the strategy. The downside breakeven level is calculated by subtracting the whole position total pay or receive to the lowest strike price in the strategy.

Combo strategy has two combinations that are bullish and bearish combo. Bullish combo strategy is for bullish market and the bearish combo strategy is for bearish market. This strategy involves two steps that are buying out of the money option and selling in the money option. If the security price goes up more than the higher strike price, profit can be generated. But if the security price goes down lower than the lower strike price, loss is incurred. If the security price fluctuates within the higher and lower strike price, you won’t loss anything. This strategy can earn an unlimited profit but also will cause an unlimited loss depending to the market direction and also which strategy you have used.

Butterfly spread strategy is quite similar to the condor strategy. It has also four combinations that are long at the money call and put butterfly spread and short at the money call and put butterfly spread. Long at the money call and put butterfly spread are for stationary market and short at the money call and put butterfly spread are for volatile market. Steps that involve in long at the money call butterfly spread are buying in the money and out of the money call option and following selling at the money call option. At the money option means the strike price of this option is quite close to the current market security price. Number of contract of the at the money call option must double the number of contract of in and out of the money option.

Profit can be generated as long as the security price does not move out from the upside and downside breakeven range. The upside breakeven level is calculated by adding the total pay out of this position to the highest strike price. The downside breakeven level is calculated by subtracting the lowest strike price with the total pay out of this position. The short at the money call butterfly spread is established by selling in and out of the money call option and following by buying at the money call option. Number of contract of at the money option must be double the number of contract of in and out of the money option. As long as the security price has move out the upside and downside breakeven range, profit can be generated. This strategy generates limited profit and also cause limited loss if the security price does not go to the right direction.

Calendar spread is also known as horizontal or time spread. This strategy is solely used to earn money from the security, which price trades sideway. There are quite number of stocks have this kind of price trend. This strategy is established by selling at the money call or put option, which has a shorter time to expiry and buying at the money call and put option, which has a longer time to expiry. This strategy merely generates the money from the time value of the option. The option that has shorter time to expiry depreciates the time value faster than the option that has longer time to expiry. Usually, the option that has shorter time to expiry is left for expire worthless. The total money that you receive after closing this position will be more than the total money that you have paid out when opening this position.

With these ten strategies, you can use to earn money from upside and downside market and also the market that trades sideway.


Trading Options

Basics for New Traders

You are here because you read or heard about someone who has "made a killing" in the market. Or you have been lured to the stock market by the promise of easy money or quick bucks. Maybe you hate your job and want to trade from home for a few hours in the morning and spend the rest of the day sitting on the beach or some other fantasy.

If that's why you are here, you are at the wrong place. Just drop me line and I will send you a list of web sites that promise quick fortunes. Quick large profits happen as often as winning a state lottery. It can happen...it just usually happens to someone else. And lotteries can't be relied upon to bring in a monthly income.

Ask yourself - How good a trader are you? How's this for a statistic. Over 70% of people trading less than 1 year consider themselves good traders. However, 95% of those same traders were losing money. And over 90% within 1 year of starting to trade will quit trading out of disgust or loss of money or both.

Too many traders enter the market without the proper tools. They fail to use the appropriate systems and methods to trade. The market no longer need be the domain of the professional trader. Traders who have the time, capital, persistence, motivation, knowledge and methodology will succeed. We are going to give you the techniques and systems that the professional use.

Not As Easy As It Looks

The ease of purchasing stocks has given the impression that trading is an easy way to make a living. All you need is to open a brokerage account, fund it, and find a method of trading... and most new traders wonder why cash is not rolling into their bank accounts. Most of us when purchasing a car or house do research, check some buying reports and agonize for weeks before the purchase. Most people buy stocks on a whim or just a recommendation and then watch their non existent profits dwindle away till all that is left is a loss. If you do not do the proper work, you losses will be someone else's profits.


Tags: , ,

Basics for New Traders

Market tomorrow

All traders trading in the share markets, already more than century, from day in day, are interested with a unique question: that will be tomorrow, growth or falling to buy or sell. The unequivocal answer to receive it is impossible, nevertheless we shall try to give basic recommendation which will help you to make correct decisions.


Tags: ,

Market tomorrow

Wednesday, February 08, 2006

Investing: NASDAQ (QQQQ) Puts as insurance

NASDAQ 100 Trust Shares (QQQQ)

RISK (MODERN PORTFOLIO THEORY) STATISTICS
N/A
3 Years
Statistic QQQQ Category
0.01 -1.19
Beta (against Standard Index) 1.37 1.06
Mean Annual Return 1.53 1.12
R-squared (against Standard Index) 69.68 86.21
Standard Deviation 15.09 N/A
Sharpe Ratio 1.09 N/A
5 Years
Statistic QQQQ Category
Alpha (against Standard Index) -3.09 N/A
Beta (against Standard Index) 1.91 N/A
Mean Annual Return -0.16 N/A
R-squared (against Standard Index) 80.79 N/A
Standard Deviation 31.80 N/A
Sharpe Ratio -0.13 N/A

I believe that we are nearing the end of this bull market that started a few years ago. There are many reasons I think that this is the case:
  • Presidential cycles: Usually the first and second year of a new president are down market years
  • Liquidity: Growth in the money supply has slowed to nearly zero.
  • Yield Curve: The difference between short term debt and long term debt has narrowed to almost nothing, this has been the most accurate predictor of a recession according to Federal Reserve research, and this is tied to liquidity declines.
  • US Dollar: The precipitous drop in the dollar that was fuelling earnings has slowed
  • Time: Cyclical bull markets in secular bear markets are typically shorter. Based on all historic bull markets we are passed the 50% mark.
  • Earnings: Growth is slowing
  • LEI (Leading Economic Indicators): Have been trending down for months
This has me worried primarily due to liquidity. Not the type of liquidity I mentioned above but the likelihood that investors will have to liquidate holdings of stocks that I'm invested in to meet margin calls on tech stocks. What really worries me is that the fall of the NASDAQ that I think is coming (and based on historical data will likely be lower than the 2001 bear market lows) is going to suck down the price of sound, undervalued companies. I hope that very few investors are both in Technology and Uranium (for example) but a sinking market is going to lower all boats!

Again I am hoping that resource stocks will fall with the market, but less so and then rise again as money will flow into the only asset class not doing quite so badly. I've invested in QQQQ puts and if the NASDAQ goes down and resource stocks up I'll make money on both sides (long resource stocks, short NASDAQ). However, if NASDAQ stocks go down and drag down resource stocks with them, I have a chance of making enough money on the NASDAQ puts to offset the losses. Ideally I would like a stash of cash on the sidelines to buy more if this happens, but with fundamentally significantly undervalued companies, I am choosing to stay fully invested and ride the tide.

These are my estimations 1-2 years out:
  • Case 1 (10%): NASDAQ Up, resource stocks down: I have no reason to believe this will happen but I lose on both sides of the trade
  • Case 2 (15%): NASDAQ Up, resource stocks up: Well I loose my QQQQ puts but I'll do well on my resource stocks, this is a good outcome
  • Case 3 (35%): NASDAQ down: resource stocks down: There is a reasonable chance that the QQQQ options will balance out the drop in my long portfolio or at least cushion the blow and avoid margin calls.
  • Case 4 (40%): NASDAQ down: resource stocks up: Best possible scenario and not entirely unlikely. There are completely different factors driving natural resources to those driving tech valuations.
I expect to end up somewhere around cases 3-4 and as time passes I think case 4 becomes more likely than case 3 as the lowering of interest rates as a result of the NASDAQ fall will probably cause liquidity to flood somewhere and natural resources are a good bet given the other fundamentally positive forces.

Anyone with exposure to the US market should well consider putting a little (10% or so) money into QQQQ LEAPS over the next 6 months. If the NASDAQ doesn't fall you had insurance (no one ever complained about paying car insurance premiums and never having a claim!) but the risk today in the NASDAQ is to the downside.

Tags: , , ,

Investing: NASDAQ (QQQQ) Puts as insurance

Tuesday, February 07, 2006

Technically Speaking, Market Analysis and Theory: It's a Long Way to the Top

Educational use only. Never intended as advice.
Ridin' down the highway
Goin' to a show
Stop in on the byway
Playin' rock 'n' roll
Gettin' robbed
Gettin' stoned
Gettin' beat up
Broken boned
Gettin' had
Gettin' took
I tell you people it's harder than it looks
It's a long way to the top if you wanna rock 'n' roll
If you think it's easy doin' one night stands
Try playin' in a rock roll band
It's a long way to the top if you wanna rock 'n' roll
--It's A Long Way to the Top, AC/DC

Technically Speaking, Market Analysis and Theory: It's a Long Way to the Top

The History of Candlestick Charts

The Japanese were the first to use technical analysis to trade one of the world's first rice futures markets in the 1600s. A Japanese man by the name of Homma who traded the futures markets in the 1700s discovered that although there was link between supply and demand of the rice, the markets were also strongly influenced by the emotions of the traders.

Homma realized that he could benefit from understanding the emotions to help predict the future prices. He understood that there could be a vast difference between value and price of rice.

This difference between value and price is as valid today with stocks, as it was with rice in Japan centuries ago.

The principles established by Homma in measuring market emotions in a stock are the basis for the Candlestick Chart analysis, which we will present in this seminar.

One profitable Free Trading System for forex based is based around a candlestick pattern called an "engulfing pattern". It is also know as an "outside day" in western charting.

Tags: , , ,

Day Trading technical analysis - candlestick chart course

The Foundations of Money Management I

People have always wanted to win at the stock exchange. But the existing industry of attracting money to the market with promising-named books, metastocks and finams of all kinds exploits our common prejudices, making us seek wrong things at wrong places. We're busy looking for a "magic" indicator or trading system that will keep us winning 90% of the time.

I've found such a system. With numerous tests it almost never had under 90% profitable trades. The results of one such a test are given in Table 1 in Omega Research TradeStation format. The code for the system is in Appendix 1; you may copy it to Omega TradeStation or SuperCharts and go along winning (in the sense they usually mean winning, that is, having a profit on most trades). The system's main secret is a pseudo-random number generator (too "pseudo" in TradeStation, but doesn't matter much). Then it all goes as usual: if the position is profitable, close it. If the market goes against us, turn investors. Having enjoyed working and socializing with customers of two brokerages over a couple of years, I can insist that is just what most traders do - except the fact they formally replace the random number generator with analytic forecasts, indicator signals, the neighbor's opinion in the pit or just a momentary impulse. The problem is that winning at an exchange and earning money at an exchange are far from being the same.

Surely, the profit seen in the Table 1 example is casual, a result of a lucky dice roll, whereas it would not be profitable in most cases. But if one changes the system entry parameters to more reasonable levels, i.e. sets mmstp=1, pftlim =4, maxhold =10, this will make the system profitable in most tests.


So exploiting the principal idea of speculation - close losing trades fast and let profits grow - combined with money management allows to earn money even from random trades. Most people act just opposite to this principle; they let losses grow, hoping the market turns and proves how right have they been, and quickly close their profitable positions to prove how right they're at the moment. Most beginners and many self-styled pros, as our experience shows, are sure that the skill of market forecasting equals the ability to earn money at the market. Getting a profit on a given trade for them means proving their prognostic abilities and, consequently, their skill in making money.

A person unfamiliar with trading as a business could be puzzled by the fact that "successful investing and trading have nothing in common with forecasting"*. There is bad news and good news. The bad news is: markets cannot be prognosed. The good news is: one doesn't need to do that to have profit. We are concerned not with getting a profit on every trade, but on making large sums when we're right. The number of profitable trades may in this case be less than losing, that is, it is possible to use worse-than-random forecasting!

As a famous trader Paul Tudor Jones said: "I may be stopped four or five times per trade until it really start moving". That is, Paul may win only on a measly 20-25% times! Yet he'd had three-figure (percents) of income in five consecutive years with very low capital corrections1. Almost 100% of Steve Cohen's very large profits are taken off 5% of trades, and only 55% of his trades are profitable at all. Despite that in the last seven years he'd made 90% per year on the average, and had only three losing months (the worst losses were -2%)2.

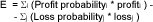
The widely used by professional methods of trend following, as a rule, bring about 30-40% of profit. Profits or losses in any given trade do not matter - as long as the amount of money earned per average trade is positive. This value is called mathematical expectancy. The mathematical expectancy equals the sum of products of profit probabilities minus the sum of products of losses probabilities, multiplied by the losses' size:

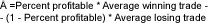
Simplified, the expectancy may be estimated as the probability of profits multiplied by the average profit minus probability of losses multiplied by the average loss. In terms of the Omega Research TradeStation this looks like:
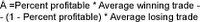
Table1.

Total Net Profit $562.70 Open position P/L ($75.60)
Gross Profit $1,269.40 Gross Loss ($706.70)
Total #of trades 276 Percent profitable 92.75 %
Number winning trades 256 Number losing trades 20
Largest winning trade $54.90 Largest losing trade ($126.50)
Average winning trade $4.96 Average losing trade ($35.33)
Ratio avg win/avg loss .14 Avg trade (win &loss) $2.04
Max consec.Winners 39 Max consec.losers 2
Avg #bars in winners 1 Avg #bars in losers 17
Account size required $177.30 Return on account 317.37%

In a newsgroup discussion one follower of Elliott's theory said: "Market is no gambling - we make no bets". Not being an Elliott adherent, for whom everything is pre-arranged, we do make bets. Since the result of any trade is unknown, any trade is a bet where we win or lose a certain sum. The principal difference between gambling (betting) and market trades (speculations) is first, that gambling creates its own risks and speculations re-distribute the risks already present on the market; second, the on a market a trader is able to provide himself with a statistical advantage, that is, a positive expectancy.

Let us review betting on a color when playing roulette. There are 18 red sectors, 18 black and the zero. The expectancy of winning for a single bet on a color is 18/37 - (18+1/37) = - 1/37. On the average the house wins from a single gambler this amount multiplied by the bet size. Despite the fact some gamblers may win a lot, it is the house that wins always - because of the biased expectancy, not because the dealer knows where the ball stops.

Appendix 1. A system giving over 90% profitable trades.
{*********************************************************
Random System 1.
Copyright (c)2001 DT
Parameter values by default: mmstp =1,pflim =4,maxhold =10
**********************************************************}
Inputs: Bias(.025), {Random entry parameter}
mmstp(100), {Stop loss parameter}
pflim(.1), {Profit target limit}
maxhold(50); {maximum holding period};
Var:Trigger(0),Signal(0),ATR(0),num(1);
trigger =random(1);
if trigger < signal =" -1;">1 - bias then signal =1;
ATR =XAverage(TrueRange,50);
{ Random Entry}
If signal =1 then Buy("Random_Mkt.LE")num contracts next bar at open;
If signal =1 then Sell("Random_Mkt.SE")num contracts next bar at open;
{ Standartized Exits}
if marketposition >0 then begin
ExitLong ("MM.LX")Next Bar at EntryPrice -mmstp*ATR stop;
ExitLong ("Pt.LX")Next Bar at EntryPrice +pflim*ATR limit;
if barssinceentry >=maxhold then
ExitLong ("Hold.LX")at close;
end;
if marketposition <0>=maxhold then
ExitShort ("Hold.SX")at close;
end;

Appendix 2. The simplest system number 2. {*********************************************************
The Simplest System 2.
Copyright (c)2001 DT
**********************************************************}
Input:Price((H+L)*.5),PtUp(4.),PtDn(4.);
Vars:TrendLine(C),LL(99999),HH(0),num(1);
if MarketPosition <=0 then begin if Price < ll ="Price;" hh ="Price;">=0 then begin
if Price >HH then HH =Price;
if Price cross below HH -PtDn *.001 then begin
Sell("Simpl.SE ")num contracts next bar at market;
LL =Price;
end;
end;

Appendix 3. Data output to a file to compute mathematical expectancy {*********************************************************
Expectancy Output
Copyright (c)2001 DT
**********************************************************}
Var:RMult(1),R1(1),Trades(0);
Trades =TotalTrades;
R1 =PctUp *.001 *BigPointValue;
RMult =PositionProfit(1)/R1;
If barnumber =1 then
print(file("D:\TS_Export \M trading.csv"),"Qty",",","Profit",",","Initial Risk",",","R multiple");
If Trades <>Trades [1 ]then
print(file("D:\TS_Export \M trading.csv"),Num:10:0,",",PositionProfit(1):10:4,",",R1:10:4,",",RMult:10:4);


To be just we should mention that it is possible to create a "gambler's advantage" - so a mathematician Edward Thorp has developed strategies with a positive expectancy for playing blackjack, which he'd successfully used in Las Vegas gambling houses. When they stopped letting him in, he published his methods1, after which blackjack rules had to be altered to remove the gambler advantage. In late sixties Thorp took interest in shares market and became a manager for a private investing partnership: " Our significant rival then was a Harry Markowitz, a future Nobel prize winner. After 20 months we had +39,9% profit compared to Dow Jones' +4,2%. Markowitz went negative in a couple of years, and we're satisfied with our stable results... about 20% yearly (standard deviation around 6%0 and zero correlation with the market".

The market allows to play games with a positive expectancy. This is a necessary condition for successful stock trading. Actually, as Ralph Vince says, "it doesn't matter how negative or how positive; only positive or negative matters". A doubtful claim from our point of view; a larger positive expectancy is superior to a smaller one.

Besides expectancy, most traders have problems understanding risk. For instance, a historian by education, (former) head of a regional investing company with assets over a million dollars by summer 1997 was sure that "risk doesn't exist so it cannot be measured" and also sure that "one shouldn't sell shares at a loss". What can one say about amateurs then� Risk does exist and it can be measured. It is considered that risk is a volatility measured as the standard deviation of the changes of actives traded. This holds true for investing risk, speculative risk is more adequately defined as standard deviation of capital changes. By both those definitions risk is heavily underestimated. According to Murphy's laws, the worst is yet to come; We shall employ the following definition: risk is the amount of money we are ready to lose before withdrawing from a losing trade.

Before opening a position it is necessary to define the point where we close the position wit a loss to save capital - the so-called stop loss1, or where we open an opposite position, having made sure of our mistake concerning the market direction - the so-called stop-and-reverse. The difference between the entry point and the stop loss point multiplied by the number of lots is the starting risk or 1 R2, independent of how and in which units we measure the stop level, be it dollars, percents, volatility units or six-packs. This definition of risk is not equal to the first definition - the risk may be many times the 1 R if the stops are not executed due to lack of discipline3, gaps against the position or unexpectedly high slippage. The profit, then, can be defined in units of risk per share or in multiples of R. In terms of multiples the basis rule of speculation will be formulated as: keep losses at the level of 1 R as long as possible and let profits reach many times R.

The expectancy in multiples of R will mean how much can we win or lose per unit of risk in an average trade. To calculate expectancy in terms of multiples of R we must place the results of our trades in a table with the following columns:

Number of lots Profit or Loss Starting risk Multiple of R

The Profit or Loss must take into account broker commissions and slippage. Multiple of R is calculated by dividing the second column by the third. Then to calculate expectance it is enough to add up the values of the fourth column and divide by the number of trades. This method is also works with "intuitive" trading.

So, we do have a winning strategy - what next?

We can open a brokerage account and bet all our capital with the maximal leverage.

Here the most important thing - the money management begins. To clear the situation here is a pair of facts. Ralph Vince invented a game, where bet size was the only moveable parameter. He chose forty doctors of sciences (i.e. not the dumbest people at least) as players, none of which were professional traders or studied statistics. The doctors played a game where 100 random trades were generated, one by one. Every one began at $1000, and before every trade one had to make a single decision - how much (up to 50% of the capital) to bet. 60% of the time the players won their bet, and 40% of the time they lost their bet. This game has an expectancy of 20 cents per dollar risked, i.e. in the long run the player can receive 1 dollar 20 cents per dollar. The academicals made their 100 bets, enough to resolve the expectancy. Making the same trades, they finished the game with different results. Guess how much of them increased their starting capital? Two of forty. 95% of doctors lost money playing a game with a positive expectation!

Van Tharp made an even more striking example. In an Asian Tour for Dow Jones Telerate TAG (Technical Analysis Group) he gave lectures in 8 cities before 50-100 listeners each time, most of them professional traders for large companies or banks that traded shares, bonds or exchange rates on Forex. In an analogous game over a half of highly professional traders lost!2 Another personal example - a trader offered a similar game to a friend employed by Charles Schwab as a leading analyst. At the first level the distribution of multiples of R with an expectancy of 0,45 and 60% profitable trades. To get to the second level one had to make 50% profit in 100 trades. The result was "I cannot get to level 2 in a day!"3. In 1991 Brinson, Singer and Beebower published a research of the efficiency of 82 portfolio managers in a 10-year period, which showed that 91,5% of all profit was generated by asset distribution3. The asset distribution meant the division of capital between cash, shares and bonds. Only 8,5% of profit was due to buying and selling the right stocks and bonds at the right time.

Let us play the game described by Vince. If there was no risk, i.e. we knew the result of each trade beforehand, it would make sense to bet all the capital each time. So every player would have gained $1000 ..(1.2 ^100)=$82,817,974,522.01 .

In reality, if we bet all $1000 on the first trade, we have a 40% risk to lose all at the first attempt. Even if we win and have $2000, betting all on the next trade would be exactly as insane.

Now suppose we bet $200 at a time. So if five first trades are losing, we again lose all. The probability of such an event is small, just over 1%. But are we ready for such a "small" risk, if we can lose all the money? Suppose we lose in the first two trades (16% probability), so we'd lose 40% of the capital. Beginning from the next trade we must gather 67% of profit just ot restore the starting capital. This effect is called "asymmetric leverage".

Table 2 shows that loses of over 50% need improbably large profits just to recover; so if we risk relatively large sums and lose our chances to end up wit a profit are negligible.

The result in the doctors' case is explained not only by oversized bets. A widely spread pitfall is so-called "gambler's error": People tend to suppose that after a series of losses the probability of a profit increases, so we raise our bets. But in this game the probability is not affected by previous results and always remains at 60%.


Suppose that we bet a certain percent of our capital and record the current capital after each trade. Repeat the 100-trades sequence again and again, and after a lot (1000 or so) series we'll be able to estimate the distribution of results. Evidently, we'll have different end profits, since the game is random-based. This is called Monte Carlo modeling.

Let us arrange the 1000 profit performances from 1000 series from smaller to larger. Then let us divide this range into 100 parts with equal number of variants in each - so every such a percentile will have 10 variants of performance. The first percentile will contain 10 worst results, and its top limit (number 10) will correspond to what they usually formulate as: "In 1% of cases the results will be inferior to... value". Statistically this percentile is called k-1. The border of the 50 percentile (k-50) would correspond to: "In 505 of the cases the result will be inferior to..."

Table 3 displays the outcomes of the 1000 series with different bet sizes in percents of the capital.

With 10% bet for each trade the minimal capital after 100 trades was 181,1$. In 1% of all trades our capital was under $405 (Profit k1). In 50% the trading yielded $4501 and less (Profit k-50). In 95% of cases the end capital was below $22411 (Profit k-95), and, corerespondingly, in 5% of cases the end capital was above $22411.

Let us review drawdowns (DD in the table). The drawdown is the difference between the maximal capital and its subsequent minimum before the new maximum is reached. With 10% bets in 50% of the cases the DD was over 48%, in 1% over 78% and the maximal DD was almost 90% of the capital. With bets over 30% of the capital we ape practically doomed to ruin. Once again we remind that this game has a positive expectancy - at win/loss probability 60% to 40% the win size relates to loss size as 1 to 1.

Steve Cohen says that: "the traders' general mistake is taking too large positions in relation to their portfolios. The, when the shares move against them, they are hurt too much to remain in control, they finally either panic or freeze in shock".

These examples described the importance of bet size in games with an undetermined outcome. So what is money management? An Internet search with those keywords yielded links to services for personal financial control, advices on handling others' money, how to control risk, on Turtle Trading, etc. According to Van Tharp, money management is NOT:

  • a part of system that dictates how much you will lose in a given trade
  • a way to exit a profitable trade
  • is not diversification
  • is not risk control
  • is not avoiding risks
  • is not a part of a system that maximizes performance
  • is not a part of the system that tells where to invest

Money management is a part of a trading system that tells "how much". How many units of investitions should be held at a time? How much risk may be taken?

So, money management is controlling the bet size. Te most radical definition known to us is given by Ryan Jones3: money management is limited to defining what sum from your account should be risked on the next trade. Pay attention that this definition does not list as money management controlling the size of an already open position, which Van Tharp allows.

Table2.


% loss 10 20 30 40 50 60 70 80 90
% profit required to recover 11,1 25,0 42,9 66,7 100 150 223,3 400 900

Table3.


Bet size k-50 DD, % k-99 DD, % Max DD, % Worst profit case k-1 profit k-50 profit k-95 profit
1.00 5.87 13.25 18.30 900 956 1.215 21.426
5.00 26.86 52.32 68.17 484 654 2.401 5.346
10.00 48.43 78.36 89.49 181 405 4.501 22.411
15.00 64.77 92.81 97.48 71 237 6.586 73.936
40.00 98.81 100.00 100.00 0 0 783 687.933


Dmitry Tolstonogov


Tags: , , , , , ,

RT Soft >Publications > Money Management

Monday, February 06, 2006

Fibonacci shapes

Fibonacci shapes are geometrical representation of nature's law and human behavior that can be applied, almost without limit, to market data series, whether cash currencies, futures, index products, stocks or mutual funds.

Correction / Retracement

Markets move in rhythms. An impulse wave that defines a major market trend will have a corrective wave before the next impulse wave reaches new territory. This occurs in either bull market or bear market conditions. The most common approach to working with corrections is to relate the size of a correction to a percentage of a prior impulsive market move.

Correction 38.2% for EMC indicates continuation of the primary up-trend.

Extension

Extensions are exuberant price movements. They express themselves in runaway markets, opening gaps, limit-up and limit-down moves, and high volatility. These situations offer extraordinary trading potential as long as the analysis is carried out in accordance with sensible and definite rules.

Price of SRX (Canada) reaches the level that can be precalculated as the previous up-swing size multiplied by Fibonacci ratio 1.618

Valleys in the down-trend of STEA (Canada) are correctly identified from the original swing size by multiplying it by 3 numbers from Fibonacci ratio scale: 1, 1.618, 2.618

Time projection

Fibonacci time projection days are days on which a price event is supposed to occur. Time projection analysis is not lagging but is of forecasting value. Trades can be entered or exited at the price change rather then after the fact. The concept is dynamic. The distance between two highs or two lows is seldom the same, and time projection days vary, depending on larger or smaller swing sizes of the market price pattern.

Length between two peaks of NT multiplied by Fibonacci ratios 1.618 and 2.618 gives accurate forecast on another two peaks drawn weeks into the future

Channel

Human behavior is not only reflected in chart patterns as large swings, small swings or trend formations. Human behavior is also expressed in peak-valley formation. Fibonacci channels make use of peak and valley formations in the market and lead to conclusions on how to safely forecast major changes in trend directions.

The secret of Fibonacci channels is to identify the correct valleys and peaks to work with. Support and resistance lines can be drawn weeks and months into the future, once the appropriate tops and bottoms in the market have been detected.

Having prominent peaks and valleys creates an opportunity to see major support and resistance lines for SUNW before they are realized by general public

Ellipse

Fibonacci ellipses identify underlying structure of price moves. Fibonacci ellipses circumvent price patterns. When a price pattern changes, the shape of the ellipse circumventing the respective market price pattern changes too. We can find long and short ellipses, fat and thin ellipses and ellipses that are flat or have a steep angle. There are very few market price moves that do not follow the pattern of a Fibonacci ellipse.

The strength of Fibonacci ellipses is that no matter how many waves or subwaves we find in a price pattern, we receive a solid overall picture of the total price pattern as long as it can be circumvented by a Fibonacci ellipse.

Never ending small waves of MSFT is not a source of confusion once the first point and a swing size are realized. Fibonacci ellipse with ratio 6.854 pin points target price and overall pattern.

Fans

Fibonacci fans name derives from the fanlike appearance of the three trendlines shown. The Fibonacci fans are drawn using typical tops or bottoms. The three Fibonacci fans project into the future with slopes at 38.2, 50 and 61.8% (additional levels are also available). As the daily prices pass these three fans, we make predictions about future price movements based upon whether there appears to be price resistance or support at these intersection points. If the prices hold at the fan line, there is support there, if they quickly move through the fan line, then you will not see support until the next fan line is met.

INTC started its bull rally in early 2003 and we were able to project support and resistance level all the way to 2004.

Spiral

Fibonacci spirals provide the optimal link between price and time analysis and are the answer to a long search for a solution to forecasting both time and price. Each point on a spiral manifests an optimal combination of price and time. Corrections and trend changes occur at all those prominent points where the Fibonacci spiral is touched on its growth path through price and time.

You will be astonished to see that if the correct center is chosen, Fibonacci spirals pinpoint turning points in the market with an accuracy seldom before seen. Investing based on spirals is neither a black-box approach nor an overfitted computerized trading system. It is a simple universal geometrical law applied to different sorts of products such as futures, stock index futures, stocks or cash currencies.

Timing and price of most key peaks and valleys of EAG are already known in late May 2003 - that is the power of Fibonacci spiral.


Tags: , , ,

Fibonacci shapes (tools)

Pair Trading

Are you tired of trying to guess the markets direction? Would you like to learn how our professional traders have been consistently taking money out of the market? Are you looking for a new strategy that can make you money and help minimize the risk? Then pair trading may be perfect for you! Our pair trading method opens the door to multi-layered trading strategies, facilitates diversification as you can trade many pairs at a time, and allows you to potentially trade larger. All this helps with a trader's confidence. Whether the market is traveling up or down or sideways, or moving fast or slow, the trader can generate profits from trading the differential of two correlated stocks an any and every day.

When you study the price action of a pair you get very powerful results. Spread trading is trading instruments that are by design quite prone to range bound trading. The chop can be easily recognized, orders enveloped around the bids and asks of the pair stocks to participate in great prints. Also, with predictability increased, the risk is reduced, and the options available to the trader increase. A pair trader actually gets to respond to the action that the market is providing, recognizes patterns and participates in a market neutral manner, not exposed, as you would be by a long position only.

The markets have changed radically in the last two years, becoming largely random with only brief periods of order. Consequently, a trader who focuses on trying to predict the overall market direction or the direction of a single stock is often disappointed. Frequently, the exact opposite outcome of what you think will happen, occurs. Many of the books written during the bubble phase of the market in the 90's focus on trading momentum during volatility and predictable order flow, and offer little help in consistently extracting profits in the current market climate.

The information and tools within this site are relevant and helpful to today's market conditions. Some tools have worked for professional traders since the inception of the markets and will continue to work well into the future.


Tags: , ,

Pair Trading

Sunday, February 05, 2006

Why you should offer your trading system on Collective2

Whether you sell a daily market timing newsletter, publish weekly stock picks, or have developed a minute-by-minute futures trading system that requires instant notification of signals to subscribers - Collective2 will make your business more profitable, and reduce your hassle and overhead.

Here's how it works

To get started, you enter a brief description of your trading system into our database. That will allow members of Collective2 to search for your system and subscribe to it.

After that, any time your system recommends a trade, you enter your trading advice through Collective2. (This is called "Entering a trade signal.") When you enter your trade signal into Collective2, two things happen.

First, all your subscribers are automatically informed about your trading advice through email (you can schedule the email to take place at a certain time, or we can send it instantly).

Second, we automatically track the results of your trade against real-time market movements, and make your results available for potential subscribers to study. This means that future subscribers will be able to trust your results and will become more likely to subscribe to your system.

We handle the drudgery - you handle the trades

We take care of all the overhead and all the hassle. We'll manage your subscriptions and unsubscriptions; we'll manage the computer servers and security; we'll bill subscriber's credit cards on your behalf; we'll send out your hundreds (or thousands!) or trading system emails. Our billing system is sophisticated enough to handle free trial periods, recurring billing at different intervals (want to sell a weekly subscription? A monthly subscription? Quarterly? We can manage it for you!) We even allow you to offer subscribers an optional pay-for-performance guarantee - where we measure your system results and charge accordingly.

Sophisticated tools to make your life easy

We are creating a growing set of sophisticated tools to help you manage your trading system. You can manage your subscriber lists, see a forecast of upcoming revenue, and broadcast messages to your subscribers, all from one Web site. In addition, we provide tools that let you link your TradeStation software to Collective2, so you can automate trade entry.

"Auto-trade" your system in a real-life brokerage account

Thanks to our partnerships with software developers like Advanced Trading Research (the developer of TradeBullet), subscribers to your trading system can auto-trade your trading advice in their real-life brokerage account.

We bring you new customers

Our Web site is young, but our membership is growing rapidly. As more and more people join Collective2, you benefit as more potential customers can see your system, study it, and subscribe to it. We are spending our own marketing dollars to increase our user base. These marketing dollars benefit you by increasing your subscription rate!

How much does this cost?

You can create a trading system, and try out all of Collective2's features for free. You'll be able to see how easy it is to trade futures, stocks, and options - and to use all of our sophisticated features (Instant Trade Messenger, auto-emails, conditional and one-cancels-another orders, etc.)

We give you five free "trade signals" that you can use to experiment with the site. We think after that, you'll be convinced that Collective2 is one of the coolest sites around for traders. Then, we'll ask you to pay a semi-annual Listing Fee to appear on the site.

Listing Fees.

First Trading System Added: $98 for six-month listing

Trading systems added in next 3 months: $73 per six-month listing

Remember, that you will get paid for each subscriber that signs up for your trading system. You can charge whatever you like. Collective2 keeps 30% of any subscriptions processed on your behalf. At the end of each month, we remit the remainder of your subscription charges back to you.

"But I don't want the whole world to see my trading signals..."

Don't worry. We don't make results of a trade public, or disclose a position to non-subscribers to your system, until your trade has been closed.

"But I can do this myself..."

No doubt you can. But there are three reasons you should offer your trading system through Collective2.

(1) We have a growing membership base. You can continue to offer your system through other channels and manage any portion of your subscribers on your own. Our service is completely incremental to that - we are growing your customer base, and helping you earn dollars you would not otherwise earn.

(2) We are trusted - and therefore so are you. By offering your system through Collective2, the fact that we are a "Trusted Platform" rubs off on you and increases your legitimacy and - eventually - your subscriber base. Because we are a trusted platform for system vendors, subscribers know they can trust you, your system, and your results.

(3) There's no risk. Just think of us as one more sales and marketing channel you can use to market your trading system. (Although we're a gosh-darn sophisticated and helpful one...) You can stop using us whenever you like. We're convinced you'll like us, though!

How do I start?

It's easy. Adding your trading system takes a minute or two, and the trial period is absolutely free. We don't even ask for a credit card. (We're so convinced you'll love us, we know you'll be back!)

Tags: , , , ,

Collective 2

Blog Archive