Markets analyses, brokers review, autotrading

Saturday, March 25, 2006

Market Making and the Index Futures Market

he financial market in the United States includes both cash and derivative markets, such as future and option markets. All kinds of products, ranging from grains to equities, and from oil to bonds, are traded in those markets.

In each market, there are participants with different objectives. Some look for long-term capital gains, some want to hedge their real positions, and still others try to make profits out of short-term price fluctuations. The concept of market making arises from such a market environment.

I. What is market making?

Market making means that a trader or a company puts both buy and sell orders into the market, and wait for people to trade with him on either sides. In every market, price is quoted with both a bid and an offer price, with the latter a little bit higher than the former. Ordinary traders and investors "take the market," buying at offer price and selling at bid price. However, market makers could sell at offer price and buy at bid price. For example, imagine that the last price of XYZ stock is 10.00 and a market maker puts a 9.90 buy order and a 10.10 sell order into the market simultaneously. If someone hits him by selling at his buying price of 9.90, he gets a long position. If he thinks that the price of XYZ stock would rise further, he would hold the position for a while and square it at a higher price. If he is neutral or even bearish, he may sell the stock right away. If the price in the next second is 9.92 Bid/ 9.95 Offer, he may make the market again by putting a sell order at 9.95 and wait for somebody to buy from him, or just sell at 9.92 to take the market. Market makers trade from market fluctuation to make money. They like volatile rather than one-sided markets. If the market keeps rising or falling, they will run into the problem of taking positions that are against most people. Market makers don't care much about the long-term trend, or fundamentals, but focus on the short periods of abnormal price movement. They trade hundreds or even thousands of round-turns every day, and accumulate small gains into big profits.

Recently, more and more automatic trading systems have come into the scene. Usually, market makers have a "seat" in an exchange, which is a kind of membership through which they can enjoy lower commission and faster access to the market. As electronic trading becomes more popular, it will replace the conventional exchange-based out-cry market. The out-cry market is the traditional market where traders stand in the pit and trade with each other through hand signals and out-cries. EUREX, the electronic trading system for European futures products, has shown great success and has become the number one futures exchange within just one year of its launch. Internet stock trading has also attracted a lot of people due to its low commission rates. In the electronic world, market makers are most welcome, since they provide greater liquidity to the market and make price moves smoother. In some equities electronic trading systems, such as Archipelago and Island, market makers can even receive commissions for each act of market making.

Though market makers get some advantages over ordinary investors, they also have more obligations. Many exchanges require that market makers give price quotes in all kinds of markets, even when all the market participants want to trade the same way. From this angle, market makers serve as a lubricant for the market, as they absorb the extremely choppy price movement.

In the world of market making, "edge" is a key word. In the phrase "grasp the edge," edge means the difference between a security's real market price and its fair value. The task for market makers is to judge how much an edge would bring them both trading opportunities and profits. There are a lot of models and systems by which to judge the optimal edges. For example, if Cisco releases earning reports that are better than expected, market participants would jump into the market to buy Cisco stocks. Market makers would try to judge whether Cisco's stock price has risen too high in the most recent minutes through some fair-value models or chart analysis. If they believe that the price has been pushed high enough to justify a short-time retreat, they would begin to put sale orders into the market-with hopes that other traders would buy at their prices-and then square their short positions as soon as the expected retreat comes.

II. Equity index futures market in the U.S.

In the United States, market-making activities exist in all kinds of markets, especially in the market for futures. Chicago is the center of U.S. futures market. People trade commodities as well as financial futures here, among which equity index futures and U.S. treasury futures are the most active. The equity index future is a future contract based on the equity index, such as S&P 500, NASDAQ, and Dow Jones indices. It is calculated by adding the cost of carry, which is equal to the interest, and then subtracting the dividends payment from the current stock index. It is the best estimate of the future stock index, and provides great hedging and trading opportunities.

When a significant event happens, people enter the futures market first to buy or sell the index futures, and then the stock market follows. For example, at the time when Microsoft waited for the court decision on its anti-trust case, the trading of its stock was halted. When the decision came out, and while the trading of its stock was still suspended, people rushed into the NASDAQ future market to hedge their positions on Microsoft. In the stock market, there are restrictions on the short sale of stocks, and when the market is bearish, people have fewer opportunities to hedge, except through selling index futures, since the futures market treats buying and selling equally.

In the United States, the stock index futures market opens nearly 24 hours, except for a half an hour break. In contrast, the stock market only opens from 9:30am to 4:00pm. Though there is an off-hour market for stocks, only some big-name stocks such as Microsoft and Cisco have liquidity during off-hours. Therefore, if any pieces of news come out at night, investors can trade index futures to hedge or speculate on those less liquid stocks.

Many mutual fund managers use the index futures to manage their customers' asset. For example, imagine that a fund manager receives a call from a customer who would like to send him two million dollars to invest in the stock market in one month. However, the customer is quite bullish about the market, and is afraid that he may have to pay higher prices to buy stocks after one month. The fund manager can then buy one-month index futures contracts to lock in the entering price. No matter what happens, the customer can be guaranteed of the option of buying the index, or the portfolio of the index component stocks, at the price specified in the futures contracts after one month.

In 1999, one of the best years for the U.S. stock market, statistics show that nearly half of the stock investment funds could not beat the return of the S&P500 index after the management fees. That means, if you just bought the S&P500 index future, and held it for the year, you would get more than 20% annual return without paying attention to selecting high-performance stocks. Therefore, investment in the index futures is a very cost-effective method.

Furthermore, since the stock index is equivalent to the capital-weighted average of component stocks, buying index futures is just like buying a portfolio of the stocks but costs lower commission fees. Therefore, trading index futures is a very efficient way to trade the whole market.

III. Should China have an equity index futures market?

China desperately needs a stock index futures market to provide an efficient hedging method for investors. A lot of Chinese investors complain that the prices of their stocks get stuck even when the market index rises because no "dealers" ("Zhuang Jia") actively trade their stocks. Under such circumstances, if there were an index futures market, these investors would be able to buy index futures to take advantage of the bull market. Furthermore, when their stocks hit the down-limit and they cannot stop loss on their stocks, they could sell the index futures to approximately square their positions.

However, many people still remember the crash of the Chinese government bond futures market. As two major financial institutions fought with each other in the market, the prices of bond futures were pushed much too far away from the prices of the underlying bonds. Eventually, one of the institutions went bankrupt, and many small investors incurred great losses. Actually, there is a very efficient way to solve such problems. In every futures exchange in developed countries, there is a committee that is authorized to determine the close prices of futures contracts. They fix not only the futures market close prices, but also the cash market prices. When they believe that the futures prices have gone too far away from the cash market prices, they have the right to change the close price of futures based on the cash market price. It is the futures close price that determines the daily mark-to-market profit or loss on each account. Therefore, no one can take advantage by manipulating the futures price while disregarding the cash market price. Furthermore, the committee could also set the futures contract prices whenever an emergency arises. When the terrorist attacked the World Trade Center in the morning of September 11th, both index futures and some blue-chip stocks had been traded for a period of time in the pre-opening market. The stock and futures exchanges were forced to close after the tragedy. Due to the event, the Chicago Mercantile Exchange (CME) committee set the close price of the index futures on the 11th just equal to that of the 10th, and disregarded the pre-session trade activity. By doing so, the committee set up a fair beginning price for every stock and for all the investors when the market reopened later.

The major concern for the Chinese government regarding opening a futures exchange might be that the trading of futures is very speculative and risky. However, there might be an alternative way through which Chinese investors can take advantage of index products. In the United States, there are two synthetic stocks, QQQ and SPY, that are the cash stock version of NASDAQ and S&P500 index futures. Investors can trade such synthetic stocks as real one, thereby eliminating the need to use leverage as with index futures. Therefore, the synthetic stocks are more for hedging purposes than for speculative uses. So if the index futures market is thought to be too risky, Chinese stock market could establish two synthetic stocks that represent the Shanghai and Shenzhen stock indices for investors to invest in and to hedge their individual stock positions.

The equity index futures market has proven to be both an effective and an efficient supplement to the stock market. As Chinese financial market develops, market making will become an important part of its functions, and an equity futures market should become an integral component.

(The author is a Trading Strategist on the index futures at the Global Electronic Trading Company (GETCO) in the Chicago Board of Trade.)


Market Making and the Index Futures Market

Tags: , , , ,

The Bid/Ask Spread and Market Making

Online brokers and many investors are quick to point out that trades can now be made for commissions of $8 or less. This makes it easy to lose sight of the fact that commissions are not the only cost of buying and selling stocks. Investors are now becoming better educated on the other cost of trading - the bid/ask spread.

Stock markets are not non-profit organizations staffed by social workers paid by the government to provide a public service. Brokers, specialists, and market makers don’t participate in the markets for their health. They trade only when they expect to make profits. Those profits are the price that investors and other traders pay in order to execute their orders when they want to trade.

The most common price for referencing stocks is the last trade price, but the last price is not necessarily the price that a person can subsequently trade now or in the future. At any given moment during market hours there is a best or highest "bid" price from someone that wants to buy the stock and there is a best or lowest "ask" price from someone that wants to sell the stock. Additionally, that bid and ask will be for a specific number of shares.

In every transaction one party is a price setter and the other party is a price taker. The price taker agrees to the price set by the price setter. In financial markets, a person who places a market order is effectively a price taker (a market sell order will be filled at the prevailing best bid price and a market buy order will be filled at the best ask price). A person who places a limit order is a price setter while a person who places a market order crosses the spread and effectively incurs a cost of half the spread. The person who placed the limit order captures that half spread. The risk for the person who places a limit order is that the order never gets filled because the price is never met.

Let take an example of Stock XYZ, which is currently quoted at 100 by 100 1/4. In other words someone is willing to buy XYZ at 100 and someone is willing to sell XYZ at 100 1/4. An investor that places an order to buy 100 shares of XYZ at the market will get executed at 100 1/4 while an investor the places an order to sell 100 shares of XYZ will get executed at 100. If the market maker placed both the bid and the ask and executed both orders he will earn the 1/4 point as a profit. The market maker profits by doing this over and over again throughout market hours. The market maker loses money when he/she fills an order and reverses the trade at a worse price.

The following is an example of how a market maker can lose money. An institutional investor places a market order to buy 100,000 shares of XYZ. The specialist agrees to sell the shares at a price of 101. The market maker is now short 100,000 shares of XYZ and will make a profit if he can buy back the 100,000 shares for less than 101. However after completing the order, the same buyer places an order to buy another 200,000 shares. The market maker now has an outstanding order to buy shares yet his interest is also to buy shares back at a lower price. The term getting "bagged" is used by some to describe the market maker’s situation. In other words, a trader or market maker completes a trade only to have the opposing party push the price further by transacting even more shares in the market.

When transacting large orders, the market maker operates under the hope that the opposing party is finished transacting in that stock or that he has charged enough of a price concession to make up for any subsequent price impact from additional trades. But if the completed order is only part of a larger decision to buy more shares, the market maker can lose money as the additional buying pressure causes the stock to rise further.

Returning to the original XYZ example, let’s take an example of a person who places a buy order for 100 shares at 100 1/8. This person is attempting to save half the spread cost (1/8) by placing a limit order. If the price rises and the order is never filled the investor will either have to live without the stock or pay a higher price. If the stock subsequently goes to 101, a person who placed a market order and paid 100 ¼ is clearly better off than the person who originally placed a limit order hoping to save an 1/8, but never purchased the stock because it moved higher. Of course, we would all make the correct choice if we knew in advance what was going to happen. Therefore, the motivation for the trade must be considered when deciding whether to place a market order or a limit order. If the order is not time sensitive a limit order may end up costing less, but a market order may be the only way to get an order filled if the order is time sensitive and the price moves against you.

Institutional investors incur opportunity costs as a result of not completing large orders and these costs can be a significant factor in performance. For more on opportunity costs see The Iceberg of Transactions Costs from The Plexus Group. The Plexus icebergs refer to costs incurred by institutional investors, which typically trade hundreds of thousands or even millions of shares at a time.

Institutional investors face the challenge of completing massive orders at a minimum cost. An institutional investor that exposes an order for a large number of shares can expect the price to jump immediately, so they may instead attempt to gradually work the order in small pieces over several days or weeks. Day traders will frequently try to buy or sell in advance of large working institutional orders if they can identify a large order in progress.

Institutional investors try to reduce their costs by trading with institutional brokers that specialize in handling large block orders and by using trading systems designed match to orders with other institutional traders. These systems attempt to eliminate the spread and any price impact. For instance, ITG’s POSIT matches trades several times during the day at the mid point of the bid/ask spread and the Crossing Network matches trades at the closing price. While trades completed through these system tend to have lower up front costs, traders run the risk of simply not getting their orders executed quickly or at all.

The purpose of a market is to provide a location where buyers and sellers can transact. The more buyers and sellers at any given time, the more efficient a market will be in matching buyers and sellers with minimum effort and costs. Electronic Communications Networks (ECNs) like Instinet and Island work well when many market participants use the system simultaneously.You can view the book for Island live on the internet, both during market hours and in after hours trading.

The NYSE and AMEX are specialist markets. A specialist is assigned to each stock and the specialist maintains a book of current bids and asks. In specialist markets, a market maker is expected to provide liquidity (by using their own capital) for large orders when buy and sell orders do not balance. The market maker takes the risk that prices will move against his position but also has the advantage of seeing the limit orders.

On NASDAQ there is no specialist so large orders can result in large price moves. NASDAQ uses a network of dealers connected electronically. Dealers place bid and ask prices on a continuous basis and trades are linked and executed electronically. Day traders tend to concentrate on NASDAQ stocks because orders and executions can be placed and confirmed with virtually no time delays. Orders placed on the NYSE may take several seconds or more to be processed through the specialist system.

Generally, the more liquid the stock the smaller the spread. Penny stocks and options have notoriously large spreads. If a security has a spread of several percentage points, an investor or trader attempting to make money would have to get several percentage points of price movement just to break even on a trade using market orders. Day traders tend to trade in very liquid stocks that have very small spreads.

Just as the internet has offered individual investors the opportunity to transact in the securities market with little or no brokerage costs, new systems and software are providing direct access to the markets giving individuals the opportunity to, in effect, become market makers. Traders can buy and sell securities with the same speed as professional market makers and securities dealers.

A difference between a professional market maker and a day trader might be that a day trader will generally open a trade and immediately try to reverse the trade while a market maker will not immediately try to reverse each trade. Over the course of the day the market maker will try to balance his book, but he will generally have more capital available and is more concerned with the average of many trades than concentrating on each individual trade during the day.

A distinction to be made with professional market makers and day traders is when they cross the line from market making activities to taking positions in order to speculate on the direction of securities. Some day traders are truly speculators trying to outsmart the market by buying in advance of market rises and selling in advance of market declines. This however is a zero sum game where someone wins a dollar for every dollar lost by someone else.

We know that market making is a profitable business because public securities firms regularly report profits from their securities trading departments and NYSE specialist firms are very profitable. Knight/Trimark for example, is a publicly traded market making firm that makes markets in thousands of Nasdaq stocks and is very profitable. The Trimark Securities division trades NYSE- and AMEX-listed equity securities over the counter. Whether or not day traders make money is a separate question that has yet to be fully determined. See Do day traders make money? Of course we know that day trading brokerage firms make money by charging their customers commissions and it’s certainly in their interest to encourage more trading.

In some foreign markets physical trading floors have already been eliminated by electronic systems and some people believe that this will eventually occur in the United States as well. Whatever happens, its clear that the technological developments of recent years are having a profound impact on the securities markets.

The Bid/Ask Spread and Market Making

Tags: , , , , ,

Monday, March 20, 2006

Hedging Soybeans - Example

Hedging in the futures market is a two-step process. Depending upon the hedger's cash market situation, he will either buy or sell futures as his first position. For instance, if he is going to buy a commodity in the cash market at a later time, his first step is to buy futures contracts.

Or if he is going to sell a cash commodity at a later time, his first step in the hedging process is to sell futures contracts.The second step in the process occurs when the cash market transaction takes place. At this time the futures position is no longer needed for price protection and should therefore be offset (closed out). If the hedger was initially long (long hedge), he would offset his position by selling the contract back. If he was initially short (short hedge), he would buy back the futures contract. Both the opening and closing positions must be for the same commodity, number of contracts, and delivery month.

Example: Assume in June a farmer expects to harvest at least 10,000 bushels of soybeans during September. By hedging, he can lock in a price for his soybeans in June and protect himself against the possibility of falling prices.

At the time, the cash price for new-crop soybeans is $6 and the price of November bean futures is $6.25. The delivery month of November marks the harvest of new-crop soybeans.

The farmer short hedges his crop by selling two November 5,000 bushel soybean futures contracts at $6.25. (Typically, farmers do not hedge 100 percent of their expected production, as the exact number of bushels produced is unknown until harvest. In this scenario, the producer expects to produce more than 10,000 bushels of soybeans.)

By the beginning of September, cash and futures prices have fallen. When the farmer sells his cash beans to the local elevator for $5.72 a bushel, he lifts his hedge by purchasing November soybean futures at $5.95. The 30-cent gain in the futures market offsets the lower price he receives for his soybeans to the cash market.

Had the farmer not hedged, he only would have received $5.72 a bushel for his soybeans - 30 cents lower than the net selling price he received.Past performance is not necessarily indicative of future results.The risk of loss exists in commodity futures trading.

Hedging with commodity futures contracts - soybean hedge example

COMMODITY SWAPS

The final class for which we will consider swapping cash flows is commodities. Commodities are physical assets such as precious metals, base metals, energy stores (such as natural gas or crude oil) and food (including wheat, pork bellies, cattle, etc.). There are two kinds of agents participating in the commodity markets: end-users (hedgers) and investors (speculators). Indeed, the Chicago exchange breaks out the open interest in the Commitment of Traders Report by hedger and speculator. It is a technical tool used by some market analysts to predict future direction.

Producers need to manage their exposure to fluctuations in the prices for their commodities. They are primarily concerned with fixing prices on contracts to sell their produce. A gold producer wants to hedge his losses attributable to a fall in the price of gold for his current gold inventory. A cattle farmer wants to hedge his exposure to changes in the price of his livestock.

End-users need to hedge the prices at which they can purchase these commodities. A university might want to lock in the price at which it purchases electricity to supply its air conditioning units for the upcoming summer months. An airline wants to lock in the price of the jet fuel it needs to purchase in order to satisfy the peak in seasonal demand for travel.

Speculators are funds or individual investors who can either buy or sell commodities by participating in the global commodities market. While many may argue that their involvement is fundamentally destabilizing, it is the liquidity they provide in normal markets that facilitates the business of the producer and of the end-user.

Why would speculators look at the commodities markets? Traditionally, they may have wanted a hedge against inflation. If the general price level is going up, it is probably attributable to increases in input prices. Or, speculators may see tremendous opportunity in commodity markets. Some analysts argue that commodity markets are more technically-driven or more likely to show a persistent trend.

The futures markets have been the traditional vehicles for participating in the commodities markets. Indeed, derivatives markets started in the commodities field.

Types of commodity swaps

There are two types of commodity swaps: fixed-floating or commodity-for-interest.

Fixed-floating swaps are just like the fixed-floating swaps in the interest rate swap market with the exception that both indices are commodity based indices.

General market indices in the commodities market with which many people would be familiar include the Goldman Sachs Commodities Index (GSCI) and the Commodities Research Board Index (CRB). These two indices place different weights on the various commodities so they will be used according to the swap agent's requirements.

Commodity-for-interest swaps are similar to the equity swap in which a total return on the commodity in question is exchanged for some money market rate (plus or minus a spread).

Valuing commodity swaps

In pricing commodity swaps, we can think of the swap as a strip of forwards each priced at inception with zero market value (in a present value sense). Thinking of a swap as a strip of at-the-money forwards is also a useful intuitive way of interpreting interest rate swaps or equity swaps.

Commodity swaps are characterized by some idiosyncratic peculiarities, though.

These include the following factors for which we must account (at a minimum):

  1. The cost of hedging
  2. The institutional structure of the particular commodity market in question
  3. The liquidity of the underlying commodity market
  4. Seasonality and its effects on the underlying commodity market
  5. The variability of the futures bid/offer spread
  6. Brokerage fees
  7. Credit risk, capital costs and administrative costs

Some of these factors must be extended to the pricing and hedging of interest rate swaps, currency swaps and equity swaps as well. The idiosyncratic nature of the commodity markets refers more to the often limited number of participants in these markets (naturally begging questions of liquidity and market information), the unique factors driving these markets, the inter-relations with cognate markets and the individual participants in these markets.

Correlation and basis

Many times when using commodity derivatives to hedge an exposure to a financial price, there is not one exact contract that can be used to hedge the exposure. If you are trying to hedge the value of a particular type of a refined chemical derived from crude oil, you may not find a listed contract for that individual product. You will find an over-the-counter price if you are lucky.

How do the OTC traders hedge this risk?

They look at the correlation (or the degree to which prices in the individual chemical trade with respect to some other more liquid object, such as crude oil) for clues as to how to price the OTC product that they offer you. They make assumptions about the stability of the correlation and its volatility and they use that to "shade" the price that they show you.

Correlation is an unhedgeable risk for the OTC market maker, though.

There is very little that he can do if the correlation breaks down.

For example, if all of a sudden the price for your individual chemical starts dropping faster than the correlation of the chemical's price with crude oil suggests it should, the OTC dealer has to start dumping more crude oil in order to compensate.

It is a very risky business.

The OTC market maker's best hope is to see enough "two-way" business involving end-users and producers so that his exposure is "naturally" hedged by people seeking to benefit from price movement in either direction.

Commodity swaps and commodity derivatives are a useful and important tool employed by most leading energy, chemical and agricultural corporations. For more information about the risk management policies of these companies, consult the footnotes of the Annual Financial Statements of these companies.


Tags: , , , ,

Article by Chand Sooran, Principal Victory Risk Management Consulting, Inc.

Mutual funds (Types of funds)

STOCK FUNDS

Also known as equity funds, these funds invest primarily in the shares of publicly traded companies. There are numerous types of stock funds.

A blend fund, sometimes known as a core fund, invests across all levels of companies -- small, mid-size and large -- and unless indicated otherwise, across both growth companies and value companies.

Small-cap, midcap and large-cap funds invest only in companies that fit those definitions, which are based on the market "capitalization," or total stock value, of the companies they invest in.

Growth funds stick to companies with potential for better-than-average profit growth, while value funds stick to companies with a low stock price relative to their earnings or such measures.

Investors should note that each fund family and each fund manager has his or her own definition of a "value" or "growth" stock, a small-cap stock and what is an acceptable level of ownership of a certain asset class to meet a fund's category.

Investors should check the fund's prospectus and Fund Profiles found on CBS MarketWatch before deciding on a fund.

BOND FUNDS

Bond funds invest primarily in the debt instruments of companies and governments. They make money both by selling bonds at a profit and through income from the coupon payments of the bonds they hold. These coupon payments also are distributed to shareholders, thus generating income in addition to potential capital gains.

Bond funds tend to be less volatile than stock funds, though there are several types of bond funds, some riskier than others. Junk bond funds, also known as high-yield bond funds, invest primarily in corporate bonds rated below what's considered "investment grade" by the major ratings agencies, Moody's and Standard & Poor's.

Municipal (or muni) bond funds invest in debt sold by U.S. cities, counties and states, while government bond funds invest mostly in U.S. Treasury bonds. Likewise, international bond funds invest in non-U.S. government and corporate debt. Investors should note that bond funds tend to go up in value when interest rates decline, and vice-versa.

BALANCED FUNDS

Balanced funds, also called hybrid funds, hold a mixture of stocks and bonds, and typically also a small amount of cash or money-market instruments.

MONEY MARKET FUNDS

Invest in short-term, interest-bearing securities. Money market funds are generally less risky than either stock funds or bond funds. The fund industry's trade association, Investment Company Institute, says "money market funds are most appropriate for short-term investment and savings goals or in situations where you seek to preserve the value of your investment while still earning income." Money market funds are designed to trade at a constant $1 a share.

INDEX FUNDS

Index funds can be either bond funds or stock funds. They invest in companies that make up a given index, such as the S&P 500 or the Nasdaq 100, in an attempt to mimic the returns of that index. Their advantage to shareholders is that they usually have lower costs than managed mutual funds because index funds do not have to hire staffs of research analysts and money managers to pick their stocks. Most also come without load fees.

SECTOR FUNDS

Stock mutual funds that invest in a specific industry sector, such as technology, health care, or energy. Sector funds are usually much more volatile than general equity funds, because sectors of the economy tend to go in and out of favor among investors, often for reasons that confound the average investor. However, they can also generate higher returns, such as the triple-digit performance of dozens of tech funds during 1999.

GLOBAL & INTERNATIONAL FUNDS

They sound like the same thing, but they're not. International funds invest solely in companies based outside the U.S., while global funds can invest in both U.S. and foreign companies. It's an important distinction, because if you're picking such funds to diversify your U.S. portfolio, a global fund might have some overlapping investments to your existing domestic funds.

CLOSED-END FUNDS

These are technically not mutual funds, although many investors consider them as such and they’re often compared with mutual funds as investment alternatives. Closed-end funds differ from open-end (mutual) funds in that they issue a set number of shares and are usually listed on exchanges, like stocks.

Like mutual funds, they invest in the stock of a number of different companies, but unlike mutual funds they do not issue and redeem new shares. Because the share prices are dictated by the market, they often trade at discounts, and in some cases premiums, to their net asset value.

EXCHANGE TRADED FUNDS

These too are not mutual funds but are often compared with them for investment purposes. Exchange-traded funds are, as their name suggests, traded on stock exchanges. Most represent shares in the companies that make up a recognized index.

The first such fund, Standard & Poor's Depository Receipts (SPY), commonly referred to as a SPiDeR, launched in 1996. At the end of April 2001, the ETF industry had grown to nearly $76 billion in assets spread across 114 funds.

Their increasing popularity among investors stems from certain advantages over mutual funds. They're priced throughout the day, options can be written on them, they can be sold short, and they have no minimum investment amount beyond the price of the individual share.

The ETF structure is also considered more tax-efficient than mutual funds because they limit the exposure to capital gains distributions that can occur when fund managers are forced to sell securities to meet redemptions.

Some of them also have lower expense ratios and better tax efficiency than comparable mutual funds. However, unlike mutual funds, investors must pay transaction fees to brokers when they purchase exchange-traded funds, which can be especially costly for investors looking to put a set amount of money in them each month.

Currently, ETFs only mimic specific indexes. But plans are underway to introduce actively managed exchange-traded products. The Securities and Exchange Commission plans to publish a "concept release" on the subject this summer.


Tags: , , , ,

Marketwatch.com

Trading Tactics

The intraday market weaves back and forth like a drunken sailor. This oscillation baffles most traders, forcing them to take positions at less advantageous prices. But this intraday swing reveals an underlying order that you can use to buy the lows or sell the highs of the day.

Timing is everything when it comes to the markets. This is particularly true with intraday price movement. Many traders ignore this fact and try to bend the market to their will. This eyes-wide-shut mentality encourages them to ignore the swing and take signals directly from individual price charts. This is a critical error, because everything is tied together these days by large-scale arbitrage.

The vast majority of stocks follow the direction of the intraday swing. Of course, each stock will be relatively stronger or weaker than the broad market. This divergence creates the mechanism that lets us buy or sell at market turns. For example, strong stocks tend to pull back to their lows just as the intraday swing reaches its nadir. Both then lift higher as buying pressure returns to the market.

Index futures reveal the intraday swing with great accuracy. But interpreting the swing is more difficult than just looking for an uptrend or downtrend. The futures markets respond to a variety of forces, but few are more powerful than the opening price principle and first-hour range.

The three levels generated by these prints set up testing scenarios for the day's trend. On positive days, index futures use first-hour breakouts and pullbacks to opening prices as springboards for substantial rallies. But interactions between price action and the three pivot points can be complex and hard to interpret at times.

One of the most common reversals starts when the index futures break the first-hour range, chop around for a few minutes and then fall back within their boundaries. This pattern failure encourages futures traders to close out positions and change directions. A new intraday swing is born.

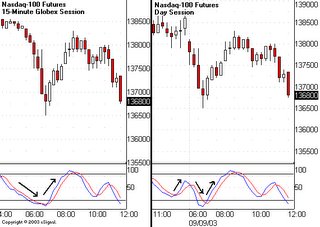
A well-tuned stochastics indicator will enable traders to visualize the intraday swing with great ease. But interpretation is everything with this classic tool. Don't assume a reversal is coming just because the reading hits overbought or oversold territory. Instead, wait for confirmation in the price pattern, or for the indicator to accelerate in the opposite direction.

The 24-hour Globex market and regular day session may reflect conflicting swing information. Smart traders use this divergence to their advantage, rather than getting frustrated by it. They wait for the stochastics readings in the two markets to line up at a high or low and then hook together in the opposite direction. This is a strong signal that the market is about to swing in the opposite direction.

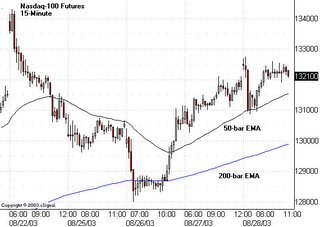
Another way to manage conflicting signals is through longer-term moving averages. I keep 50-bar and 200-bar exponential moving averages on all my 15-minute futures charts. These averages reflect the tendency of new swings to develop when standard deviation pulls back to very low levels.

Commonly, price bars in one session will pull back to the 50-bar exponential moving average at the same time the other session reaches its 200-bar exponential moving average. This convergence predicts a strong reversal, especially when combined with converging and hooking stochastics. Add in a successful test at the opening price or first-hour range, and realize the market is trying to get your attention.

I rarely trade index futures directly. Instead, I use these coordinated signals to buy or sell stocks at the most advantageous prices of the day. Of course, this adds in another level of convergence-divergence analysis. I want to see my stock charts confirm price action in the index futures before I take action, whenever possible.

Here's an example of how this all works. I bought Talk America (TALK:Nasdaq - commentary - research) last Friday within 7 cents of the daily low. I'd been looking for a selloff and reversal that morning because of a swing trade setup I call the "dip trip." The stock's V-bottom reversal printed right at a major Fibonacci retracement and short-term moving average. It also corresponded exactly with the lows for the day in the index futures.

Time-of-day bias adds a final dimension to intraday swing mechanics. In most sessions, the market reverses sharply off the opening thrust within the first half-hour of trading. The underlying strength or weakness of the move that follows often dictates the nature and amplitude of price swings for the entire day.

The market often prints another reversal about 90 minutes before the closing bell. This swing can dissipate quickly or trigger a last-hour stampede in one direction or the other. The convergence or divergence of this final thrust with price action on individual stocks can lead to perfectly timed entry signals for overnight holds.


Technical Analysis Traders Wheel: swing trading tactics, tutorials and strategies for day trading and short-term trading using technical analysis.

Thursday, March 02, 2006

Global Penny Stocks - How We Pick Stocks

This is not rocket science or brain surgery. Actually, it is probably more complicated, since rocketry and brain surgery are pretty much exact sciences. Stock picking is not. A slew of cross-currents go into the thought process. Here are most of the factors we consider, though there are some we don't disclose (can't give away all of our penny stock picking secrets).

Recent Gains. Multiple times, every day, we scan the NYSE, NASDAQ, and AMEX for those stocks under $5.00 that are recording the best percentage gains. We then track them for a few days to see if they have "legs". And, of course, we learn what moved them to begin with.

The Balance Sheet. Pretend that stock picking is comparable to creating the Universe. Look upon the Balance Sheet as The Big Bang. Does the company have ample cash and assets to keep it afloat for the next year or two? Is it laden with too many liabilities, such as a heavy debt load? If the Balance Sheet seems reasonably sound, then, half the work is done.

Analysts' Ratings. Although we do not give this much weight, seeing analysts covering a company does provide some degree of comfort.

Institutional Ownership. We do not give this much weight, either, except if a brokerage(s) owns a good chunk of a company, then they may be more inclined to see it succeed.

The Story. The company must be relatively easy to understand - after all, who needs a physics lesson. Is the company in a hot industry sector? If it's high tech or biotech, what kind of proprietary technology do they own? Number of patents? What does their customer base look like and how deep is it? Then, we read the recent news, which can steer us toward a better vision for the future. For example, has a technology company had new product releases? Or has a biotech neared a Phase 3 clinical trial or received an FDA approval? Also, we like a company to be over four to five years old, because that gives us an idea as to their staying power. And, needless to say, we look for any snags, which, in some situations may not be all that detrimental.

Target Prices. Besides giving you all of the above with every recommendation, we also put target prices on all stock picks. However, you need not keep in lockstep with us; choose a target price that feels good to you.

YOUR Big Question. How should I use this Newsletter? We suggest selecting four to six stocks - no need to do it all at once; wade into it. Only pick those that are amicable to your comfort level. AND, do not bet the house on pennystocks - also known as small cap stocks and micro cap stocks. We recommend only allocating 10% to 12% of your total investment dollars.

A Final Thought. This formula has been good to us since we started publishing in 1996. Since then, over 70% of our closed positions are for gains of 50% or greater! That is probably why this is the ONLY penny stock site recommended in Barron's and by Forbes.


Tags: , , ,

Global Penny Stocks - How We Pick Stocks

Blog Archive