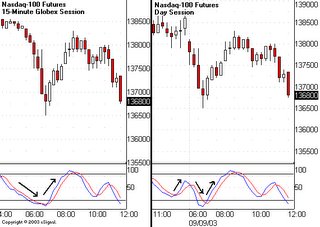
Timing is everything when it comes to the markets. This is particularly true with intraday price movement. Many traders ignore this fact and try to bend the market to their will. This eyes-wide-shut mentality encourages them to ignore the swing and take signals directly from individual price charts. This is a critical error, because everything is tied together these days by large-scale arbitrage.
The vast majority of stocks follow the direction of the intraday swing. Of course, each stock will be relatively stronger or weaker than the broad market. This divergence creates the mechanism that lets us buy or sell at market turns. For example, strong stocks tend to pull back to their lows just as the intraday swing reaches its nadir. Both then lift higher as buying pressure returns to the market.
Index futures reveal the intraday swing with great accuracy. But interpreting the swing is more difficult than just looking for an uptrend or downtrend. The futures markets respond to a variety of forces, but few are more powerful than the opening price principle and first-hour range.
The three levels generated by these prints set up testing scenarios for the day's trend. On positive days, index futures use first-hour breakouts and pullbacks to opening prices as springboards for substantial rallies. But interactions between price action and the three pivot points can be complex and hard to interpret at times.
One of the most common reversals starts when the index futures break the first-hour range, chop around for a few minutes and then fall back within their boundaries. This pattern failure encourages futures traders to close out positions and change directions. A new intraday swing is born.
A well-tuned stochastics indicator will enable traders to visualize the intraday swing with great ease. But interpretation is everything with this classic tool. Don't assume a reversal is coming just because the reading hits overbought or oversold territory. Instead, wait for confirmation in the price pattern, or for the indicator to accelerate in the opposite direction.
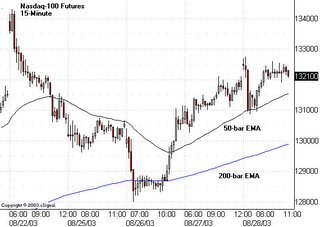
Another way to manage conflicting signals is through longer-term moving averages. I keep 50-bar and 200-bar exponential moving averages on all my 15-minute futures charts. These averages reflect the tendency of new swings to develop when standard deviation pulls back to very low levels.
Commonly, price bars in one session will pull back to the 50-bar exponential moving average at the same time the other session reaches its 200-bar exponential moving average. This convergence predicts a strong reversal, especially when combined with converging and hooking stochastics. Add in a successful test at the opening price or first-hour range, and realize the market is trying to get your attention.
I rarely trade index futures directly. Instead, I use these coordinated signals to buy or sell stocks at the most advantageous prices of the day. Of course, this adds in another level of convergence-divergence analysis. I want to see my stock charts confirm price action in the index futures before I take action, whenever possible.
Here's an example of how this all works. I bought Talk America (TALK:Nasdaq - commentary - research) last Friday within 7 cents of the daily low. I'd been looking for a selloff and reversal that morning because of a swing trade setup I call the "dip trip." The stock's V-bottom reversal printed right at a major Fibonacci retracement and short-term moving average. It also corresponded exactly with the lows for the day in the index futures.
Time-of-day bias adds a final dimension to intraday swing mechanics. In most sessions, the market reverses sharply off the opening thrust within the first half-hour of trading. The underlying strength or weakness of the move that follows often dictates the nature and amplitude of price swings for the entire day.
The market often prints another reversal about 90 minutes before the closing bell. This swing can dissipate quickly or trigger a last-hour stampede in one direction or the other. The convergence or divergence of this final thrust with price action on individual stocks can lead to perfectly timed entry signals for overnight holds.
Technical Analysis Traders Wheel: swing trading tactics, tutorials and strategies for day trading and short-term trading using technical analysis.


No comments:
Post a Comment