My Favorits Trading World

Markets analyses, brokers review, autotrading

Wednesday, May 30, 2007

Volume Profile Charts


Investor/RT provides Volume Profile charts which break down the buy volume (at ask), sell volume (at bid), total volume, and "delta" of volume (buy - sell volume) at each price, and into various bar periods including minute bars, second bars, range bars, price bars, volume bars, tick bars, and "day" bars. Each bar provides rows at the bottom of the chart which give the cumulative delta, total volume, and max and min delta achieved during that bar. The charts update tick-by-tick and include a replay feature which allows the user to playback the current day, or any previous session, at a variety of speeds. In addition to charting volume, these charts can plot either trades, or time (in seconds) at each price, and divide them up into buy and sell traders (or time). A "Volume Breakdown" indicator is also available that allows the user to access the various volume levels (buy, sell, total, delta) on traditional bar charts of any periodicity. The Volume Breakdown indicator also comes with a "delta bar" option which plots the open, high, low, and closing delta of each bar.

The chart above is an Investor/RT Profile chart setup with the preferences seen below. This particular chart is setup with 30-minute split bars, but a variety of periods are available. This chart is designed to breakdown the volume at each price, and divide it between buy volume and sell volume. Buy volume is defined as volume that occurred at the offer/ask. Sell volume is defined as volume that occurred at the bid. The difference between these two values (Buy volume minus Sell volume) is referred to the "delta" and can be a good indicator of buying or selling pressure. Volume can optionally be broken down by "Big vs Small" trade volumes or "Up vs Down Tick" volumes (as opposed to Buy vs Sell Volumes). However, "Buy vs Sell Vol" is the most common choice and generally regarded as the most informative.

Cumulative Columns
The first 7 columns represent cumulative values for the day (or for the view period specified, if other than "current session"). All columns except the price column are optional. These columns represent the following pieces of data:

  • Price
  • SxB = Sell Vol x Buy Vol
  • Dlta = Delta (Buy Vol - Sell Vol)
  • Vol = Total Volume
  • %Vol = % of Volume
  • Value Area - Volume-based value area (where 70% of volume traded)
  • Profile - this histogram profiles the total volume at each price, and breaks it down into buy volume (dark blue) and sell volume (light blue). The red bar represents the open, while the green bar represents the current/last price. The arrow ">" is placed to the right of the POC bar (the bar with the greatest volume).
Along the bottom of the chart, the SxB, Dlta, and Vol columns are summed to show the cumulative buy volume, sell volume, delta, and total volume numbers for the day. The Max and Min of the Delta columns is also shown to display the highest and lowest overall delta values achieved during the session.

Split Bars
The right side of the chart breaks down the sessions volume into different bar periods. Several bar periods are available, including:

  • Minutes - Time-based bars composed of any number of minutes.
  • Seconds - Time-based bars composed of any number of seconds.
  • Range - Volatility-based bars composed of any range of price.
  • Change - Volatility-based bars composed of any change of price.
  • Volume - Activity-based bars composed of any amount of volume. Each bar has equal amount of volume. Trades can be split into multiple bars.
  • Trades - Activity-based bars. Similar to volume bars, each bar is composed of a user specified number of trades/ticks.
  • Reversals - Volatility-based bars, building upon the concept of Point and Figure.
  • Prices - Volatility-based bars composed of any number of prices. Similar to range bars, except the magnitude is expressed in number of prices, instead of actual price range.
  • Days - Time-based bars. Day bars are relevant only for multi-day viewing periods, and allow multiple day bars to be seen on a single profile.
The chart above is divided up into 30-minute bars. Bars are labeled with the ending times of the bars. The chart above also shows the delta values at each price, but several other options are available, including:

  • Delta (B - S Vol)
  • Sell x Buy Vol
  • Total Volume
  • % of Volume
  • Color Only
  • Volume (Delta Color)
  • % of Volume (Delta Color)
  • Delta Histogram
  • Volume Histogram
The prices within each bar are shaded based on either volume (blue shading) or delta (red/green) shading. If volume shading is used, the darker the shade of blue, the higher the volume. If delta shading is used, negative deltas are shaded red, while positive deltas are shaded green. The darker the shading, the higher the delta.

The extra blue-shaded column on the right of the current bars shows the total volume numbers for the current bar. This column is optional. If the bars are showing volume, then this bar will show delta values instead.

Just left of the price column is a bid/ask column. This column show the bid and ask prices, along with the sizes at each price. Optionally, the user may choose to show the volumes traded at the bid and ask prices since the current bid and ask were established (reset each time bid/ask line changes).

Investor/RT

Market Profile +

Market Profile + (MP+) is part of Steidlmayer Software’s (SSI) "Capital Flow Software" program. SSI has licensed from the CBOT the right to use the name MP+, and SSI controls the re-licensing rights to this program. Aspen Research Group, Ltd. and Patsystems (PATS+) are approved vendors of this product.

Market Profile vs. MP+

In 1982, Peter Steidlmayer introduced Market Profile, a horizontal histogram of an instrument's daily range with a keen perspective on intraday price movement. Market Profile's initial scope was limited to intraday interpretation. This alone was sufficient to set Market Profile apart from other charting techniques. Market Profile shows range development a bar or candle cannot provide, giving a richer perspective on real-time price change.

MP+ applies the principles of Market Profile to the problem of assessing portfolio value real-time. While a familiarity with Market Profile helps in understanding MP+, there are some important differences you should note:

  1. Where Market Profile is bound by the temporal schedule of an individual instrument, MP+ is not.
  2. Where Market Profile is designed to analyze the price movement of a single instrument, MP+ is designed to study the composite value of a portfolio.
  3. The MP+ Y axis scale represents the profitability of a position rather than the price of an instrument.
Boundaries

MP+ is designed to study holding behavior by analyzing a position, which today typically consists of many long and/or short positions in several, often different, instruments. MP+ poses no constraints on the composition of a position. A position may consist of futures, stocks, currency cross-rates, mortgage backed securities, or all of the above, and more. Think of a position as a composite instrument, or X Fund.

You define constituent members of a position as a basket using Aspen's Baskets menu. To display the Baskets menu, select Baskets in the Market Profile menu. The Basket menu enables you to combine your holdings in a single instrument.

Market Profile was designed to study an instrument's intraday trading activity within a daily scope. As a chart of a single instrument, Market Profile's starting and ending points are instrument's open and close. By contrast, MP+'s starting and ending points of MP+ are a function of a composite instrument's value. MP+ has three governing properties:
  • Minimum
  • Break Points
  • Days History
The Minimum parameter defines the minimum number of half hour periods for each plot. Once the minimum number of periods has been attained, MP+ applies the Break Points property. If the value of the position has moved away (up or down) from the opening by the number of Break Points, MP+ commences a new plot. The Minimum and Break Points properties default to 12 and 9, respectively. (The Days History properties defines the number of days of thirty minute bar data to analyze; the default is 20.)

http://www.aspenres.com/Documents/AspenGraphics4.0/Market_Profile_+.htm

Sunday, August 20, 2006

Profitable stock market trading need not be difficult

Profitable stock market trading need not be difficult. Indeed, profitable trading of
the QQQQ can be fun. If your experience in trading the stock market has not been profitable, then you are probably also hurt by the number of missed opportunities or incorrect timing of your trades. What you need, then, is some guidance. You need to learn about the trading mistakes you make. Whether you trade the QQQQ, NASDAQ stocks, or qqqq options, you need to know ahead of time certain key market indicators in order to trade profitably. This is true irrespective of whether you are into day trading, or holding your stocks for longer periods. There is lots of money to be made in online trading, provided you have a trading strategy. But first, we'd like you to answer these questions:

Do you wish you could change your trading style to become more profitable, but by taking only low risks?

Do you wish you could trade more sensibly whereby you knew before hand the risk/reward trade off?

Do you wish that you had more leisure time to spend with your family or friends instead of worrying about your recent trades in the stock market?

Do you wish you could trade fewer times yet make a whole lot more money in the stock market?

Then read on…

In order to make money in the stock markets, you need to have BALANCE!

A fine balance between risk and reward that gives YOU the advantage.

A balance that gives you the means to achieve your profit GOALS.

Trading stocks without using Technical Analysis is like driving a car without a map. You will go wherever the road takes you, getting off and on randomly. You will certainly arrive some place, but probably not at your desired destination. Profitable QQQQ trading, for example, is possible if you follow a "method". We have advised hundreds of traders all over the world, including some of the richest people in the world. These traders are professional traders. A few of them own their private jets. They would not enter into a single deal without first checking what the technical indicators say. Why do you think they do this? They realize that no matter what their personal opinion is about the value of technical analysis, the market as a whole relies on this key factor. They know that ignoring chart points will cost them dearly. They know that with the help of technical analysis, they can enter into and out of trades at precise levels that allow them to control risk, and enables them to ride a good trade to its fullest potential. DO YOU WANT TO JOIN THEIR RANK? Then read on..

Let us first dispel some myths about trading in the stock market:

Myth Number 1:

"You have to trade many different stocks in order to make money, because you win in some and lose in some."

Nothing can be farther from the truth. Investing is different from trading. If you are an investor, then yes, you need to have a diversified portfolio to reduce your risks. Even then, you are only diversifying the so-called "systematic" or company-specific risk.

The truth about trading is this. What you need to make money is to concentrate, and gain experience in one or two instruments. That way, you would know the past behavior, and key levels that were significant. You can be profitable by trading just one stock, the QQQQ for example. Profitable trading of QQQQ is easier because it is a very liquid market.

Myth Number 2:

"It is easier to make money by buying dips and selling rallies."

Indeed, you will make money if you had bought the dip prior to the rally, and vice-versa. But consider what would happen if the market continues to go lower after you had bought a stock. When would you know you made an incorrect trading decision? Many traders see a stock declining by a few dollars and think it is time to buy because they have seen a dip. This approach could work some of the times, but most of the time one would end up losing.

Myth Number 3:

"If the economic news is good, it is time to buy."

This is a short cut to disaster. Professional traders often buy in anticipation of news, and when the news is actually out, they get out of that trade, exactly when the novice wants to buy!

Myth Number 4:

"Averaging a position is a good way to reduce your holding cost."

Sure, if you are an investor who is committed to a position, then averaging is a great way to be ahead. But if you are a trader, then you are in an entirely different ball game. You can't keep adding to a losing position and hope it will turn out to be ok in a few days. The question is when will I know if a trade is bad? Technical analysis will give you some good clues.

Myth Number 5:

"You have to be trading daily, or regularly to make money."

This is another big mistake. You don't have to be in the market all the time to make money. Trading should not be an obsession for you. You should be patient for the right level to get into a trade. Otherwise, you will end up trading your emotions. In these pages, CraftyStox will give you invaluable clues. In the examples you see in these pages you will learn about timing your trade in the market, how to place your stop-loss order and what your exit strategy should be. Thus, you will be able to assess if the risk-reward trade off is good for you. And the best news is that this intelligence is available for you for free.

craftystox.com

Strange options prices

Respect. I do somthing here:
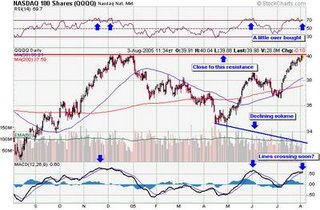
QQQQ (Nasdaq 100 index tracker) Aug $40 options calls are trading at $0.80/$0.85 and puts are trading at $0.70/$0.75. What makes it strange, is QQQQ price. QQQQ is trading below $40 ($39.50$39.95). Puts should be more expensive than calls in this situation, does everyone see the market in too positive light (and too less fear for correction)? If so, it might go just the opposite way than the market expects.

Update (August 3, 2005 11:56 AM):
In reply to the comments I'll add a chart to show some warning signs:

I am definitely not saying that QQQQ will go down (I would buy puts myself, if I was so sure), just pointing out that the rise is not so easycoming as the market predicts (according to the prices of QQQQ Aug $40 calls and puts).

Correction (August 3, 2005 12:34 AM):
Of course, QQQQ was trading at $39.95, not $39.50 as I wrote. Sorry for the typo!
trading-online

Portfolio method of risks management Fixed Ratio

Method Fixed Ratio developed by Ryan Jones, means that the ratio of number traded contracts, to an increment of the capital, should be to constants. It is the basic concept of a method! Thus, at use of a method, risks increase only due to the received profit, allowing effectively reinvestment the earned profit.

Such approach, first of all, is interesting to aggressive speculators who use buy-power and perform inreaday trading on sevral stocks.
This method has been modified and generalized up to a portfolio which is presented in Fixed Ratio Calculator.


How to use the calculator? First it is necessary to initialize initial data on which the method leans:

  1. init asset – a seed capital. This value remains to constants during all time work of a method and never change.
  2. leverage – a leverage of your broker
  3. DD – maximal drawdown in percentage which you are ready to suffer on a portfolio.
  4. ticker – the stock’s name.
  5. price – the current price of stock, may be change a few.
  6. dd– drawdown used strategy for a year, or critical stop-loss, may be change a few, in points.
  7. shares – number of shares in conreact specification.
  8. part – a portion of stock of money eauation in a portfolio, in percentage.

Blog Archive